
Prepared by: Adina Najwa Kamarudin and Norhaiza Ahmad
Data visualization plays an important part in researches. It is easier for human minds to identify patterns as well as comprehend and communicate information through graphical displays and charts. There are many tools available in different software and application packages to put together information in a way that data can be visualized. These tools could aid analysts in creating automated visuals, thus discovering insights to data.
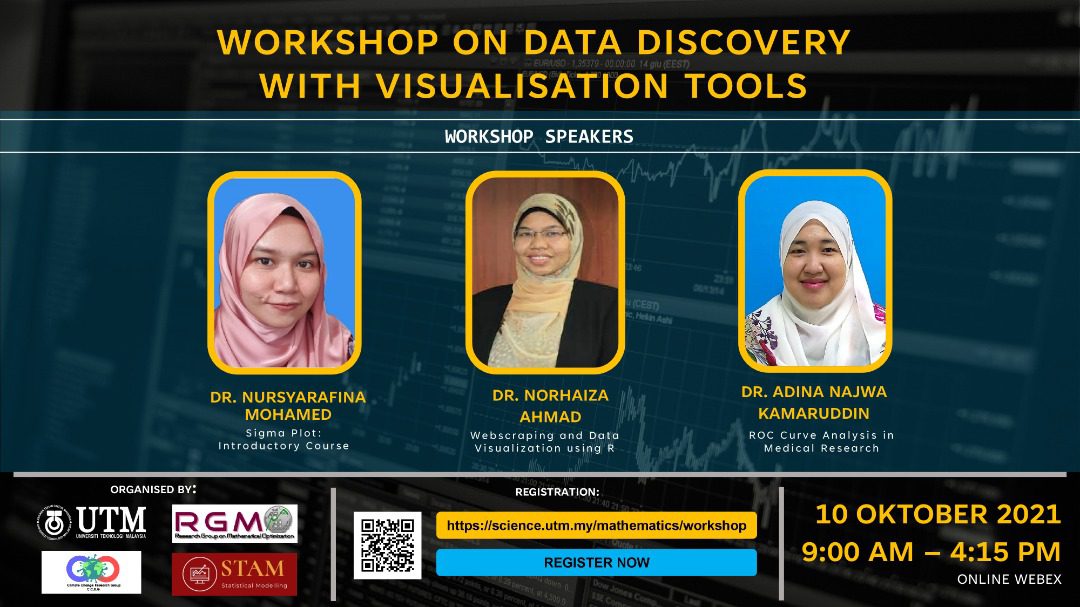
A one-day virtual hands-on workshop on “Data Discovery with Visualization Tools”, organized by three research groups from the Department of Mathematical Sciences, Faculty of Science: Statistical Modelling Research Group (STAM), Climate Change Research Group (CCRG), and Mathematical Optimization Research Group (RGMO) was held on 10th October 2021. This workshop showcased three rapid but comprehensive hands-on sessions, focusing on different approaches in discovering and visualizing data.
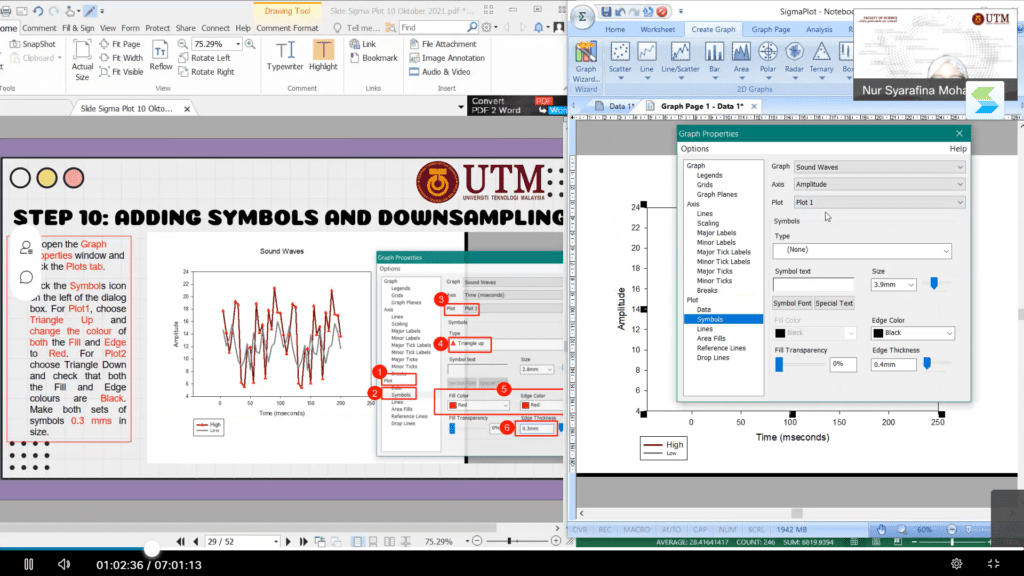
The first session focused on Sigma Plot, a scientific graphing and data analysis tool which can be used for various applications. The instructor, Dr. Nur Syarafina Mohamed demonstrated step-by-step procedures from input data for analysis until graphs were produced. This kind of sharing gave added knowledge to participants in producing impactful graphs easily.
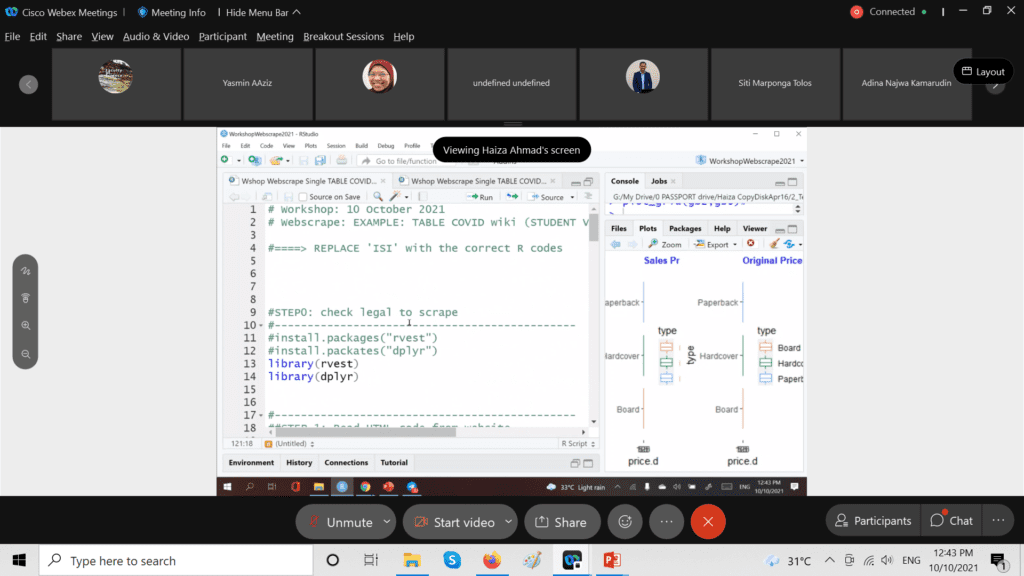
The second session was centred on web scraping using R software. Among the contents shared in this session included ethics of scraping information from the web, installed packages, and visualization of scrapped information. Participants were given R-scripts beforehand and packages required for installation to closely follow the steps and together produce similar outputs as shown by the instructor, Dr. Norhaiza Ahmad.
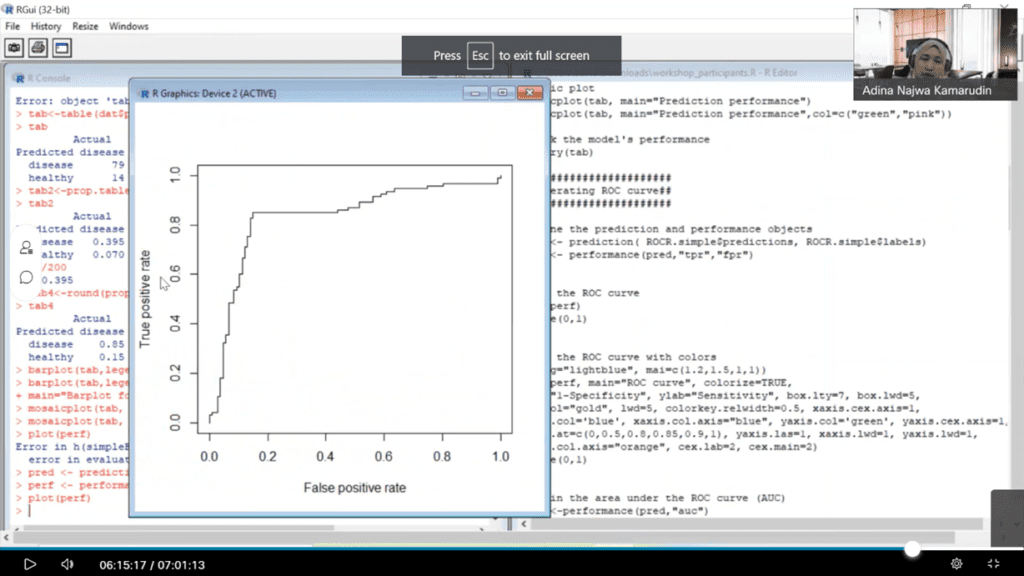
The third session, delivered by Dr. Adina Najwa was about ROC curve analysis using R software. The ROC curve is a well-established tool, particularly in medical research to evaluate screening test discriminative power. Here, ROC curve analysis for both classical and time-dependent approaches were demonstrated. Examples using medical data to produce ROC curves were taught to participants in this session.
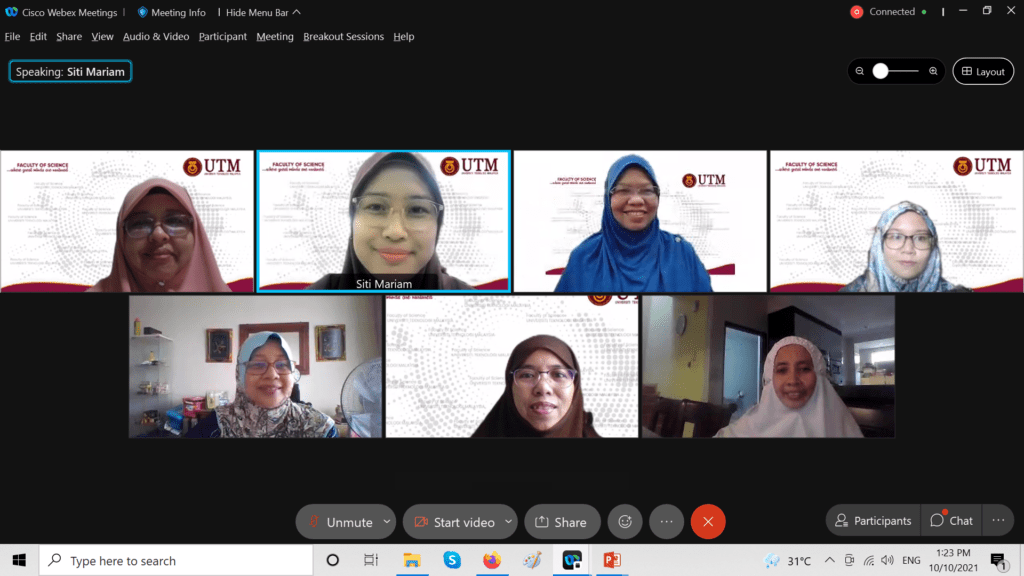
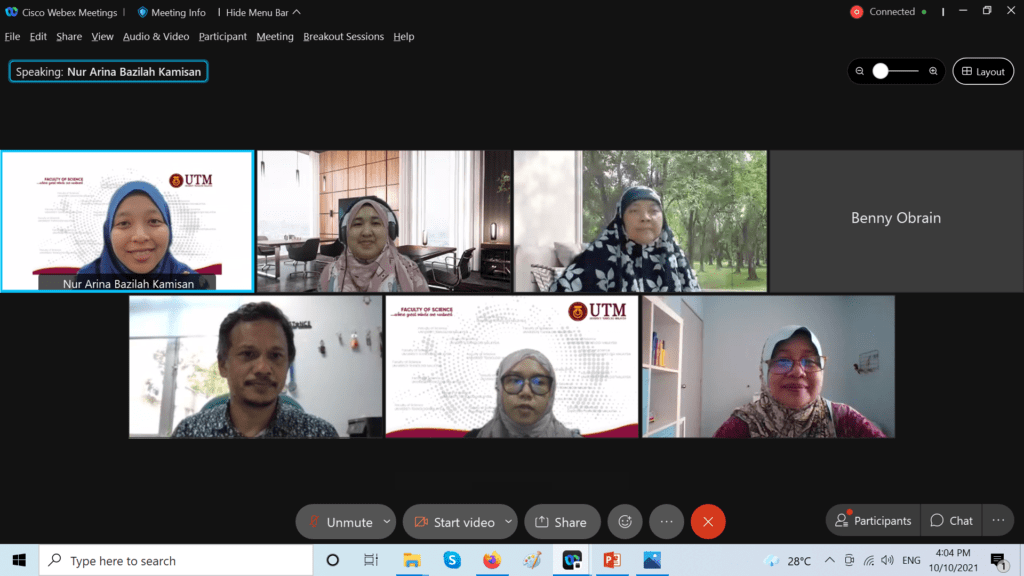
This workshop was well attended by participants consisted students and researchers from local and international institutions. The organizers received encouraging feedback from participants after the workshop. Many of them expressed interest in similar courses in the future. This event has successfully enhanced the attendees’ knowledge on several data visualization tools. The workshop ended with a closing remark by the organizers and a photo session.
Further information on this event is available at https://science.utm.my/mathematics/workshop/